Monitoring extensions for MirageOS: syslog, Influx reporter, memtrace, log level adjustment.
| src | ||
| .gitignore | ||
| CHANGES.md | ||
| dune-project | ||
| LICENSE.md | ||
| monitoring-experiments.opam | ||
| one.png | ||
| README.md | ||
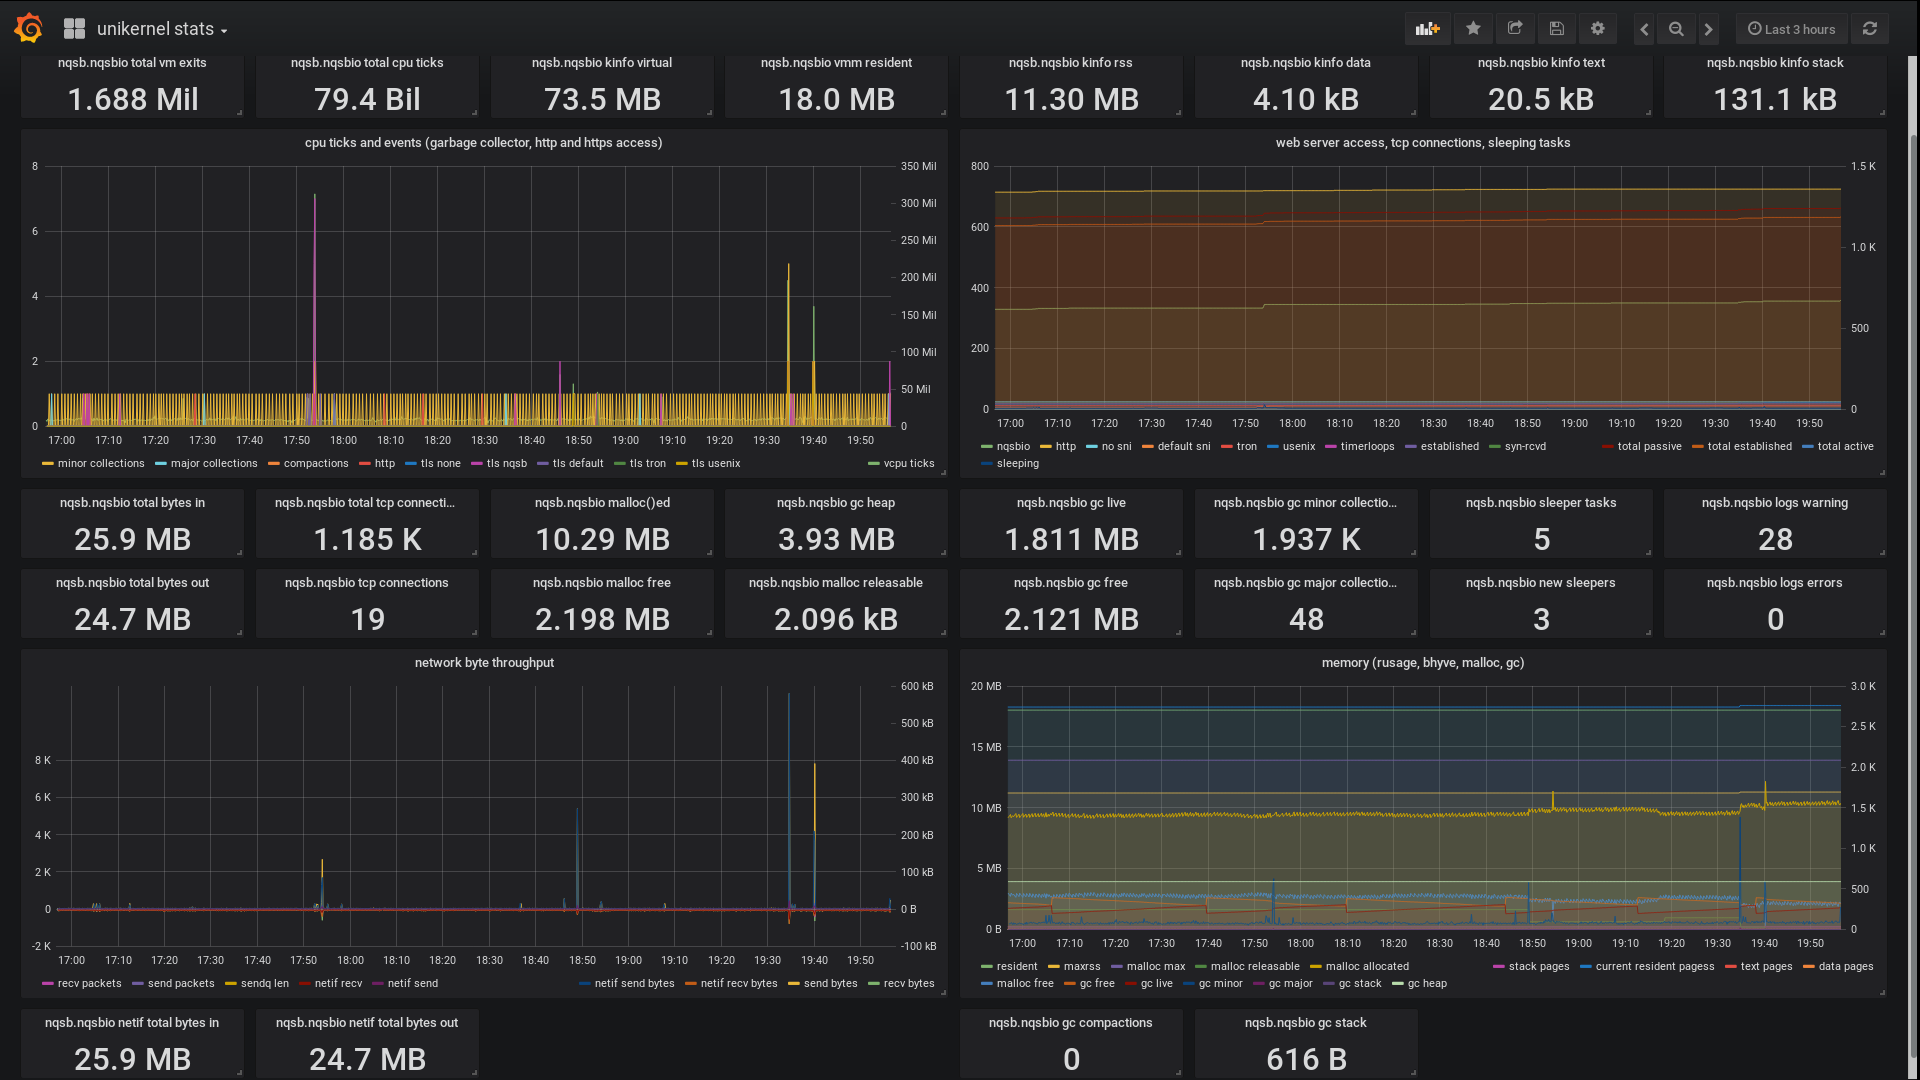
Grafana Unikernel monitoring experiments
Using Influx, Telegraf, etc.
Dynamic adjustments of Log level and Metrics reporting
The create function has a listener_port argument. If this is provided, then on the given port TCP connections to the unikernel are possible. Each connection can transmit a command (as text) to adjust log level and enable or disable metrics sources:
The log level (prefix L) is specified, the same as the command-line argument -l:
L*:debugall log sources are enabled on the debug level.Lmonitoring-experiments:errorthe log source monitoring-experiments is set to the error level.L*:info,monitoring-experiments:debugall log sources are enabled on the info level, and the log source monitoring-experiments is set to the debug level.
The metrics (prefix M) sources can be enabled and disabled based on source name.
First, if present, the all command is executed, then the tags, then specific sources:
M*:disable,memory:enable,net-solo5:enabledisables all metrics sources, and then enables memory and net-solo5.Mnet-solo5:disabledisables the net-solo5 metrics source.Mtag:http:enableenables all metrics with the http tag.
The log levels for the log sources can be inspected:
lreports the default log level and the log level for all log sources with a different log level.l*reports the default log level and the log level for all log sources.lmonitoring-experiments,dnsreports the log level for monitoring-experiments and dns respectively.
Likewise, metrics status can be similarly inspected:
mreports the default metrics status and the metrics status for all metrics sources with a different status.m*reports the default metrics status, all enabled tags, and the metrics status of all metrics sources.mmemory,net-solo5reports the metrics status for memory and net-solo5 respectively.
