51 lines
2.6 KiB
Markdown
51 lines
2.6 KiB
Markdown
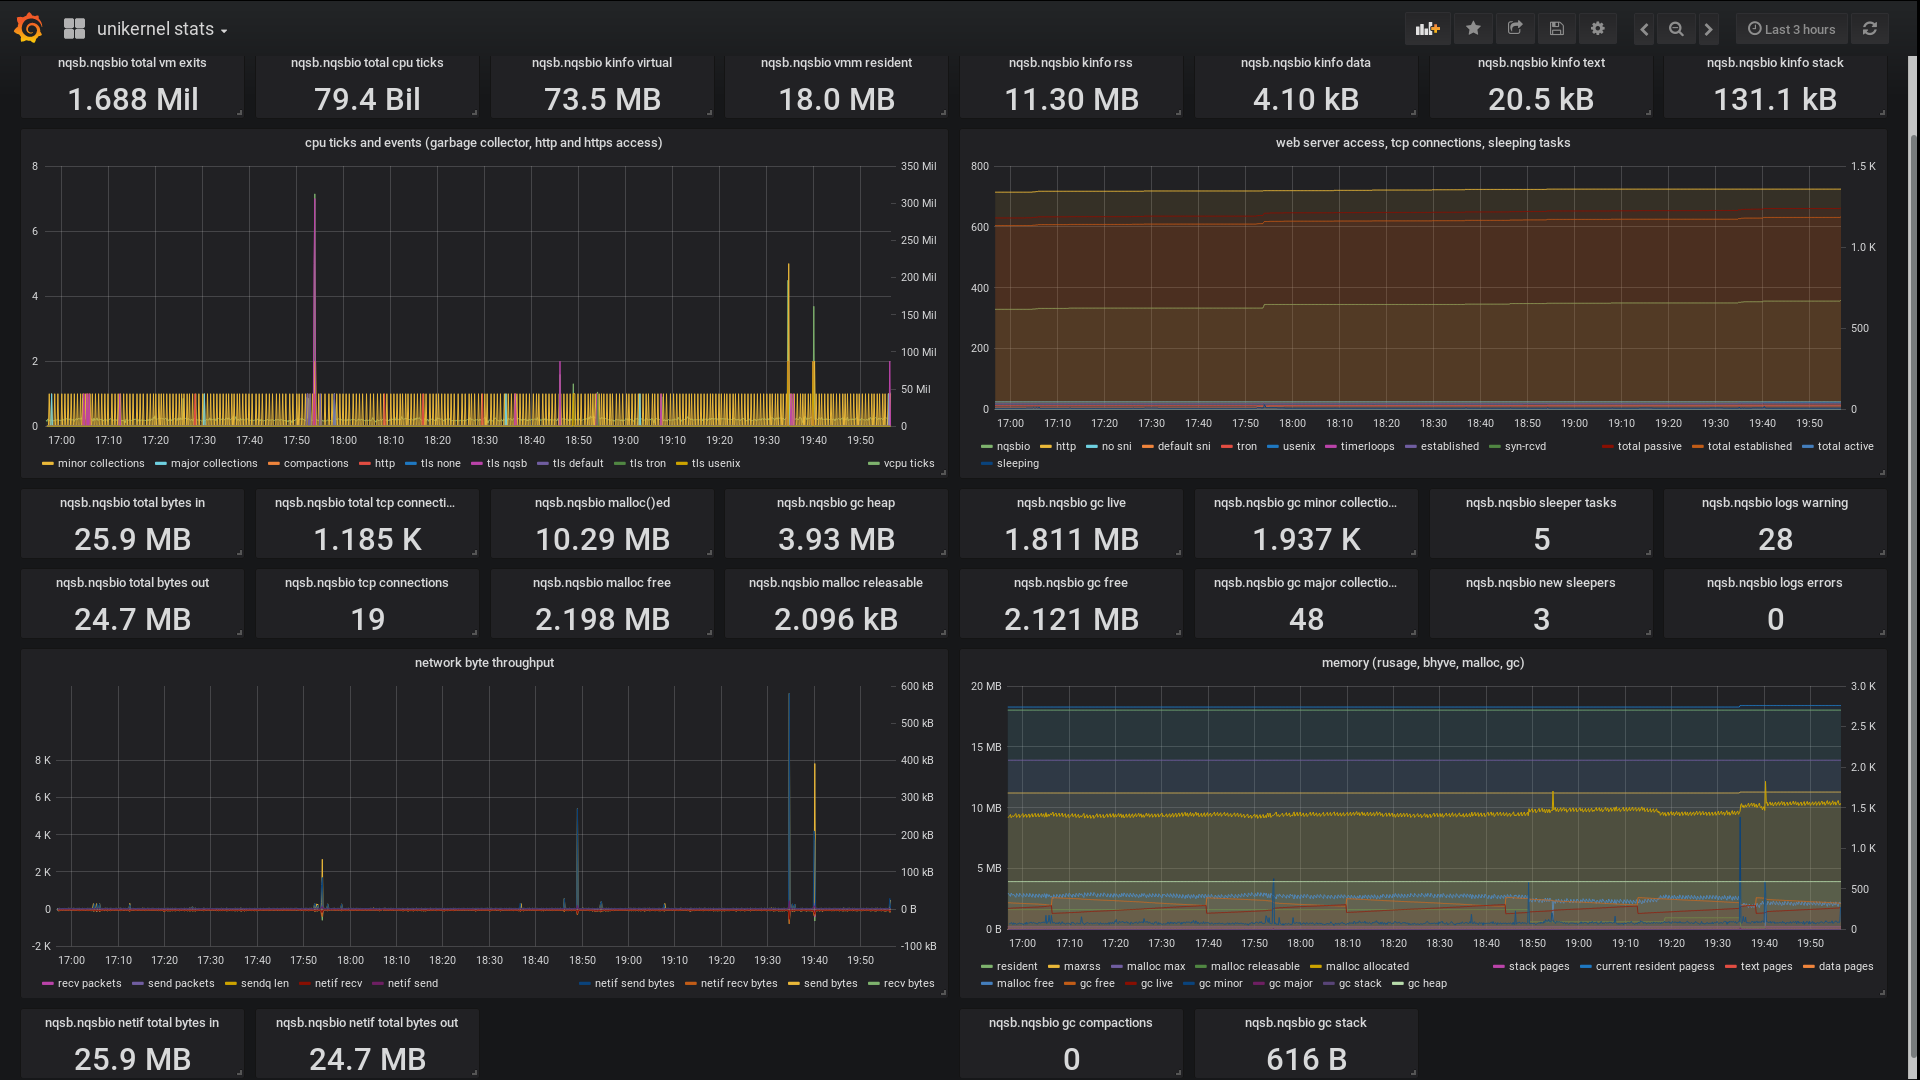
# Grafana MirageOS Unikernel monitoring
|
|
|
|
Using Influx, Telegraf, etc.
|
|
|
|
|
|
|
|
Best used on a private network interface for your unikernel.
|
|
|
|
# Output metrics to influx / telegraf
|
|
|
|
The provided `ip:port` in `create` is used to send every `interval` seconds
|
|
gathered metrics to, using the Influx wire protocol.
|
|
|
|
# Dynamic adjustments of Log level and Metrics reporting
|
|
|
|
The `create` function has a *listener_port* argument (defaulting to 2323). On the
|
|
customizable port TCP connections to the unikernel are possible. Each connection
|
|
can transmit a command (as text) to adjust log level and enable or disable
|
|
metrics sources:
|
|
|
|
The log level (prefix `L`) is specified, the same as the command-line argument `-l`:
|
|
- `L*:debug` all log sources are enabled on the *debug* level.
|
|
- `Lmonitoring-experiments:error` the log source monitoring-experiments is set to the *error* level.
|
|
- `L*:info,monitoring-experiments:debug` all log sources are enabled on the *info* level, and the log source monitoring-experiments is set to the *debug* level.
|
|
|
|
The metrics (prefix `M`) sources can be enabled and disabled based on source name.
|
|
First, if present, the all command is executed, then the tags, then specific sources:
|
|
- `M*:disable,memory:enable,net-solo5:enable` disables all metrics sources, and then enables *memory* and *net-solo5*.
|
|
- `Mnet-solo5:disable` disables the *net-solo5* metrics source.
|
|
- `Mtag:http:enable` enables all metrics with the *http* tag.
|
|
|
|
The log levels for the log sources can be inspected:
|
|
- `l` reports the default log level and the log level for all log sources with a different log level.
|
|
- `l*` reports the default log level and the log level for all log sources.
|
|
- `lmonitoring-experiments,dns` reports the log level for monitoring-experiments and dns respectively.
|
|
|
|
Likewise, metrics status can be similarly inspected:
|
|
- `m` reports the default metrics status and the metrics status for all metrics sources with a different status.
|
|
- `m*` reports the default metrics status, all enabled tags, and the metrics status of all metrics sources.
|
|
- `mmemory,net-solo5` reports the metrics status for memory and net-solo5 respectively.
|
|
|
|
# Memprof tracing
|
|
|
|
The `create` function has a `memtrace_port` argument (defualts to 4242). On this
|
|
port, when a TCP client connects,
|
|
[OCaml memory profiling](https://ocaml.org/api/Gc.Memprof.html) is started and
|
|
dumped to the client. The `sampling_rate` (defaults to 1e-4) is used. This uses
|
|
the [memprof-mirage](https://github.com/hannesm/memprof-mirage) package.
|
|
|
|
The output trace is best being viewed with
|
|
[memtrace_viewer](https://github.com/janestreet/memtrace_viewer/).
|